

 PROCHECK-NMR Operating Manual


 PROCHECK-NMR Operating Manual
The program generates two output files, in PDB format, for each of the following sets of distance restraints:-
Various options allow you to specify which types of restraints and violations you want extracted.

 Violated restraints

 Satisfied restraints
Then, to run viol2pdb, enter:
where:
In the former case, the ranges_file must be present and its format the same as for the ranges files in AQUA and PROCHECK-NMR (see Selecting model- and residue-ranges). The only difference here is that, if no model ranges are defined, the program will assume you require Model 1, rather than all models.
The alternative to the ranges file is entry of a single model number (see examples below). All residues in that model will be included. You can also extract the restraints and violations for all the models in the ensemble by entering an asterisk (*) for the model number. However, the resultant output will probably be far too cluttered and confusing to be of any use.
If no ranges file or model number are entered the program will use the first model encountered in the ensemble.
To define which you want extracted, enter the required combination of the letters S, M and L. For example, to extract only the long- and medium-range restraints you would enter: LM. By default the program includes all restraints (ie equivalent to SML).
would run viol2pdb on Model 2 of the file 1nmr.pdb, extracting all the long- and medium-range restraints.
The following command:
would run viol2pdb on 1nmr.pdb using the models and residue ranges defined in the ranges file 1nmr.ranges. Only long-range restraints would be included.
                       Satisfied              Violated
       NOE:        1nmr_noesatis.pdb     1nmr_noeviol.pdb
       H-bond:     1nmr_hbsatis.pdb      1nmr_hbviol.pdb
       S-S:        1nmr_sssatis.pdb      1nmr_ssviol.pdb
where the name of the original PDB file is 1nmr.pdb.
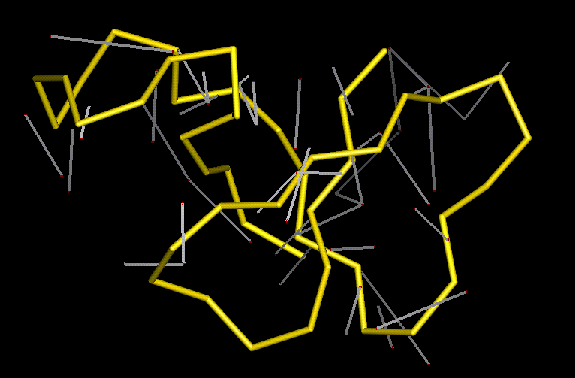
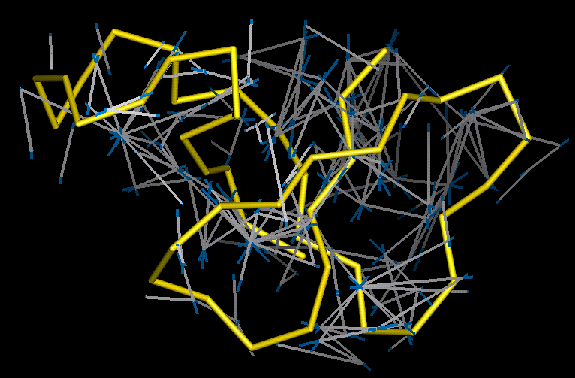
When viewed in QUANTA or RasMol the resultant sets of "bond-lines" should show the following:-
Thus, if there are many long blue lines it may be that the upper-bounds have been set too loosely and there is room for tightening them.
Note that, other molecular graphics packages may show the restraints in colours that are different from those described above. Also, there may be problems with the way that the restraint lines themselves are linked by the program's "bonding algorithm" (see below).
The line-segments corresponding to the red, white and blue lines described above are obtained by "bonds" between oxygen, hydrogen and nitrogen "atoms" in the PDB files created by viol2pdb. All the atoms are defined in HETATM records and the linkages between them are defined in the CONECT records at the end of the file.
For this reason, it is important that the molecular graphics package uses only the CONECT records in determining which "atoms" are "bonded". If it uses its own algorithm (eg on the basis of distances or residue types) the resultant set of bonds will not give the desired result.
Therefore, you may need to switch off the package's standard bonding algorithm when loading in the PDB files generated by viol2pdb.
Sometimes QUANTA can behave erratically when the bonding criteria are changed, and may even apply the new criteria to all structures on screen, so a little patience and trial-and-error may be required to get everything right.


 PROCHECK-NMR Operating Manual