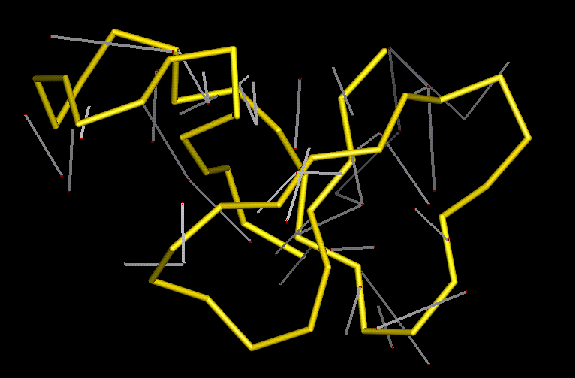
The figure above shows how the violated distance restraints output by viol2pdb are depicted in QUANTA.
The solid yellow bonds show the protein's C-alpha backbone trace. The white sticks, with their red caps, correspond to the violated NOE distance restraints. Each white line represents the length of the upper-bound distance restraint while the red caps show by how much the actual distance extends beyond this to reach the atoms themselves (ie by how much the restraint is violated).