

 PROCHECK-NMR - Sample plots


 PROCHECK-NMR - Sample plots

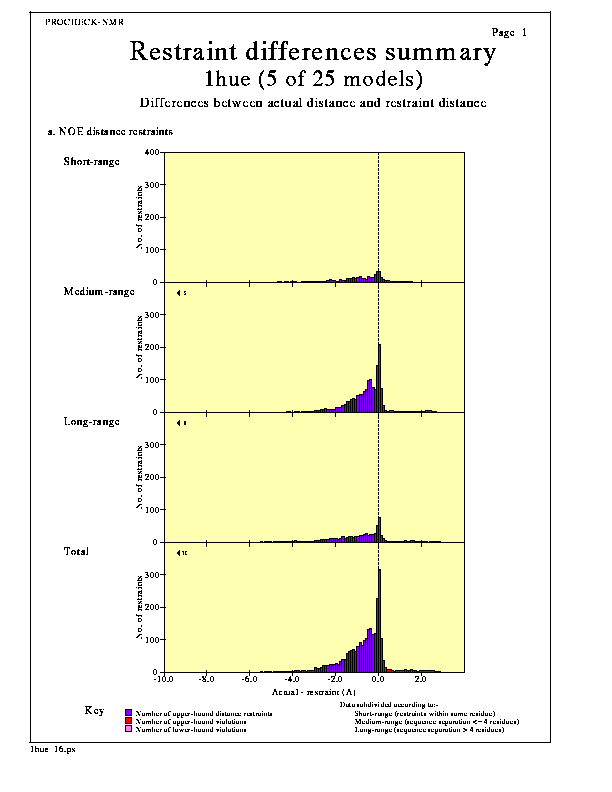
This plot shows a histogram of the differences between the actual distances between restrained atoms and the corresponding upper-bound restraints.
Positive values correspond to upper- or lower-bound violations and are shown by the highlighted bars to the right of the y-axis. Negative values give an indication of how far the actual distances lie within the corresponding upper-bounds. Large negative values suggest excessively lax values have been applied for the upper-bound restraints.
The main options for the Actual distance - restraint summary plot are:-
These options can be altered by editing the parameter file, procheck_nmr.prm, as described here.


 PROCHECK-NMR - Sample plots