


 PROCHECK-NMR - Sample plots
PROCHECK-NMR - Sample plots
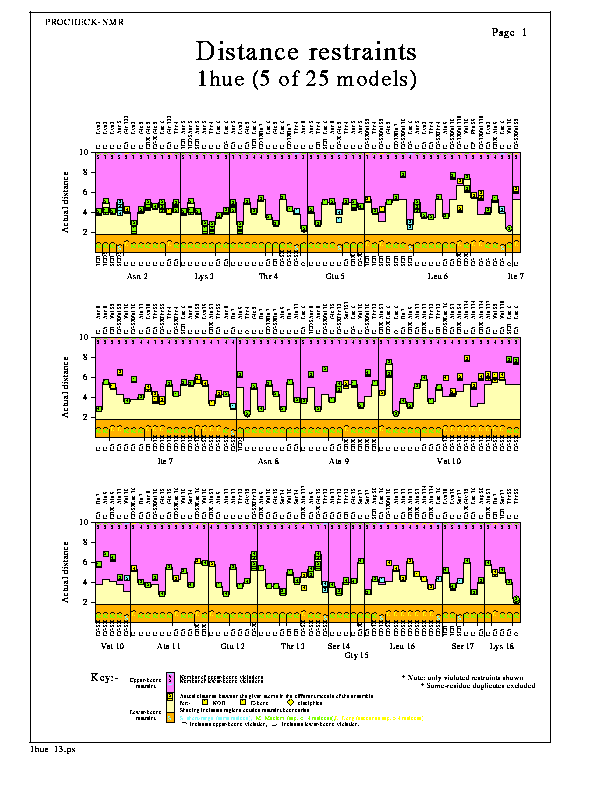
The Distance restraints plot shows the actual distances corresponding to each of the NMR distance restraints as found in the models of the NMR ensemble. The shaded regions at the top of each plot correspond to the upper- distance bounds, while those at the bottom of each plot correspond to the lower- distance bounds. Any data points that appear in these shaded regions represent upper- or lower- distance bound violations, respectively.
The numbers of models violating each upper-bound restraint are shown at the top of the graph, while the numbers of models violating each lower-bound restraint are shown set slightly lower down.
By default only the violated restraints are shown, though you can opt to plot all restraints (ie unviolated as well as violated - see Options below).
The distances are grouped by residue, the corresponding atom-names being given at the top and bottom of the graph-box.
The shape of each data point corresponds to the type of distance restraint, as follows:-
The colour of each data point corresponds to the class of distance restraint, as defined in the General parameters. The restraints are also labelled L, M or S according to this class (ie Long, Medium or Short).
The main options for the Distance restraints plot are:-
These options can be altered by editing the parameter file, procheck_nmr.prm, as described here.
PROCHECK-NMR - Sample plots