

 PROCHECK-NMR - Sample plots


 PROCHECK-NMR - Sample plots

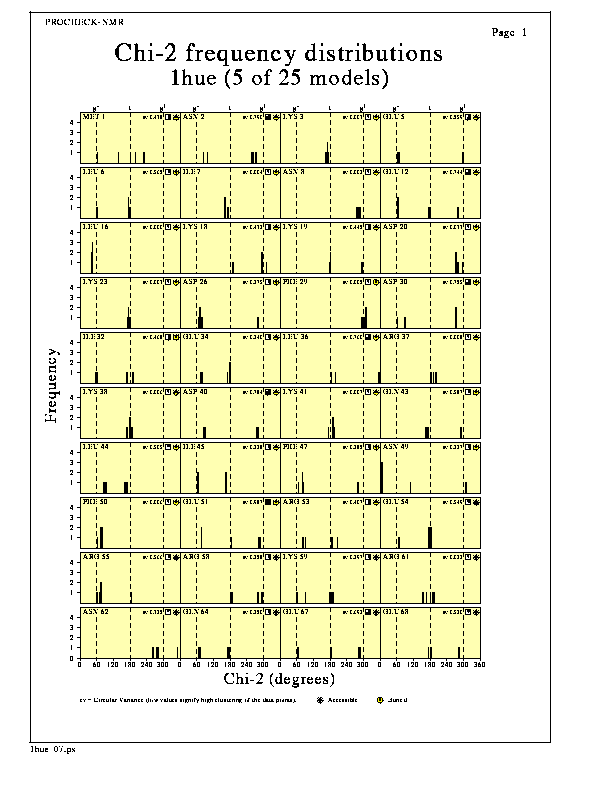
The Residue Chi-2 torsion angle plots show how the chi-2 dihedral angles vary for each residue across the different members of the NMR ensemble. (The values can also be plotted as a "progression" of values, as is shown for chi-1 here).
The dotted lines correspond to the most-favoured chi-2 conformations: namely, gauche minus, trans and chi1 gauche. One would normally expect the values to cluster around these conformations; however, for some residues - most notably Asn, Asp and Trp - the most favourable conformations tend to be displaced slightly from these positions.
Where any of the residues have had restraints applied to the dihedral angle, the ranges of these are shown on the plots as the darker bands. The numbers of violations of these restraints, if any, are printed on the plot.
It is sometimes possible to see how the values cluster at the borders of these restraint ranges, as though trying to escape from the range, suggesting that maybe the range itself may be incorrect.
The top right-hand corner of each residue's graph shows:-
The main options for the Residue Chi-2 torsion angle plots are:-
These options can be altered by editing the parameter file, procheck_nmr.prm, as described here.


 PROCHECK-NMR - Sample plots